Honest answer: it depends on the Cubs schedule. With 81 home games plus summer concerts, the blocks around Clark and Addison fill with fans, music and traffic on a regular basis. People who live here plan around it or join in. The rest of the time you have the same things the rest of Lakeview has: restaurants, coffee, live music at Metro, and a quick trip to the lakefront or the Southport Corridor.
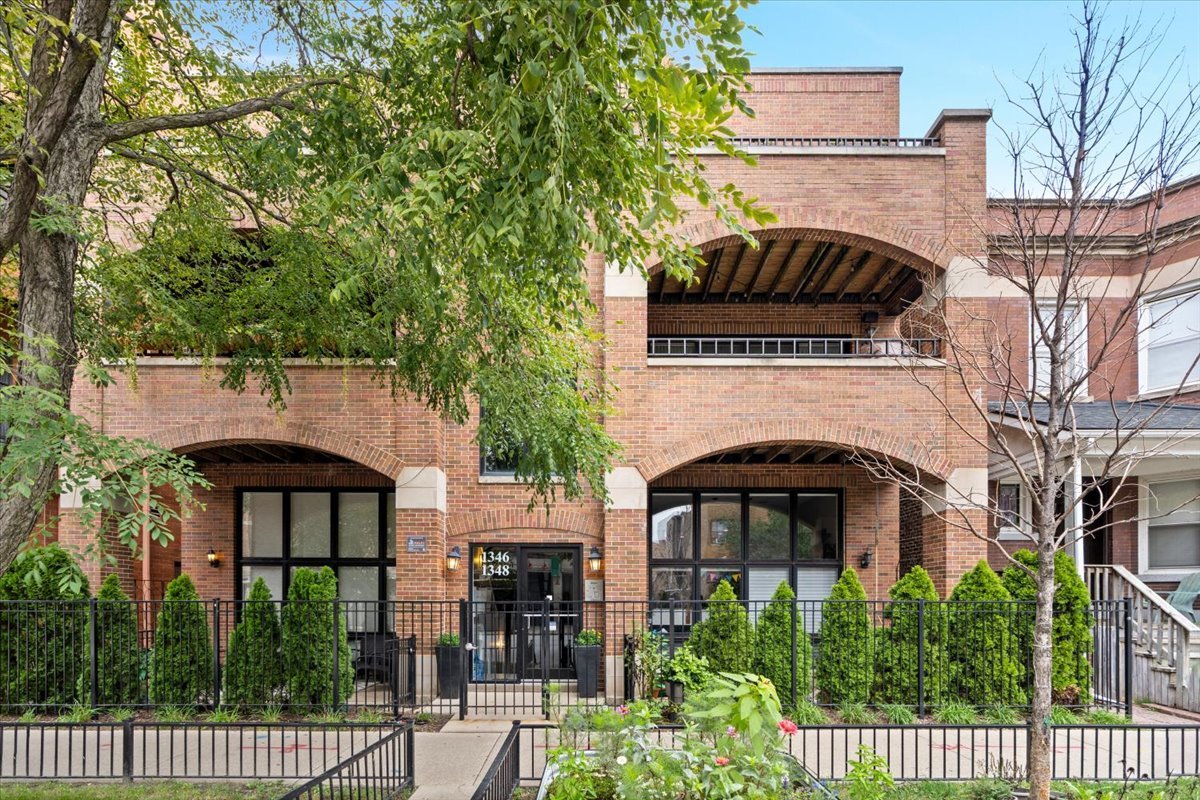
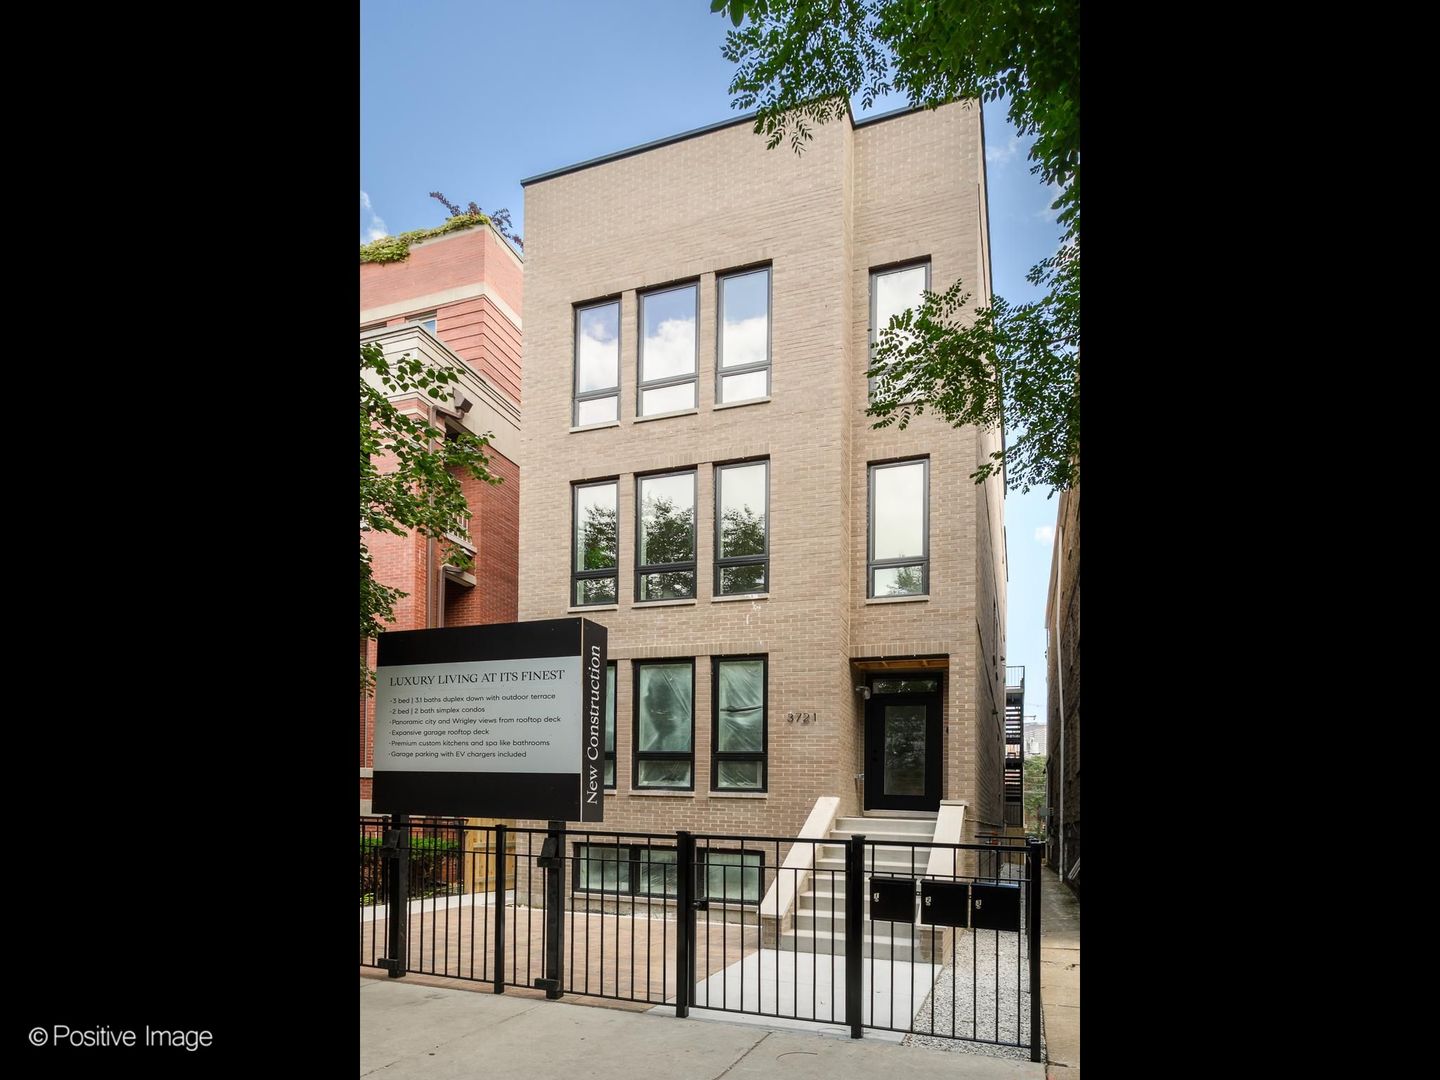
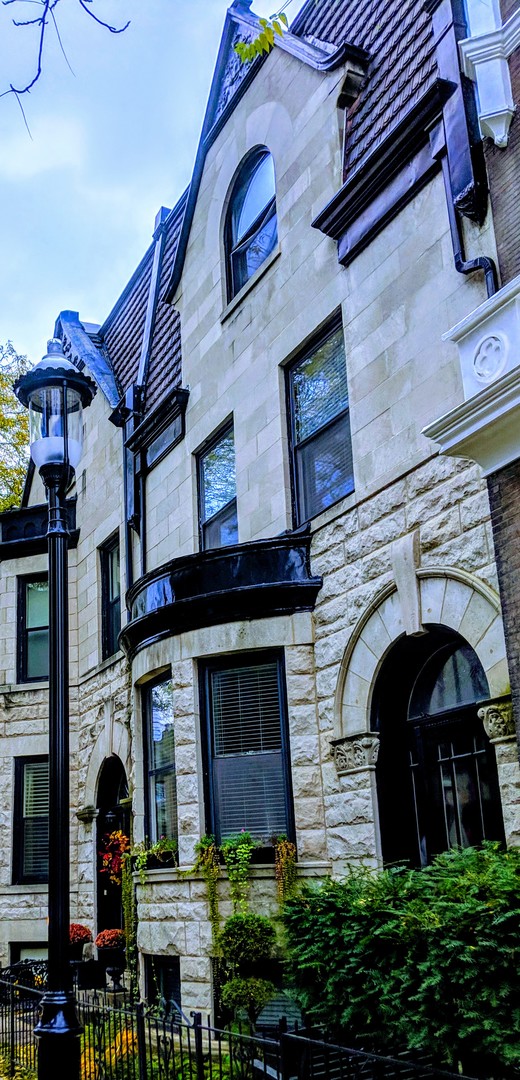
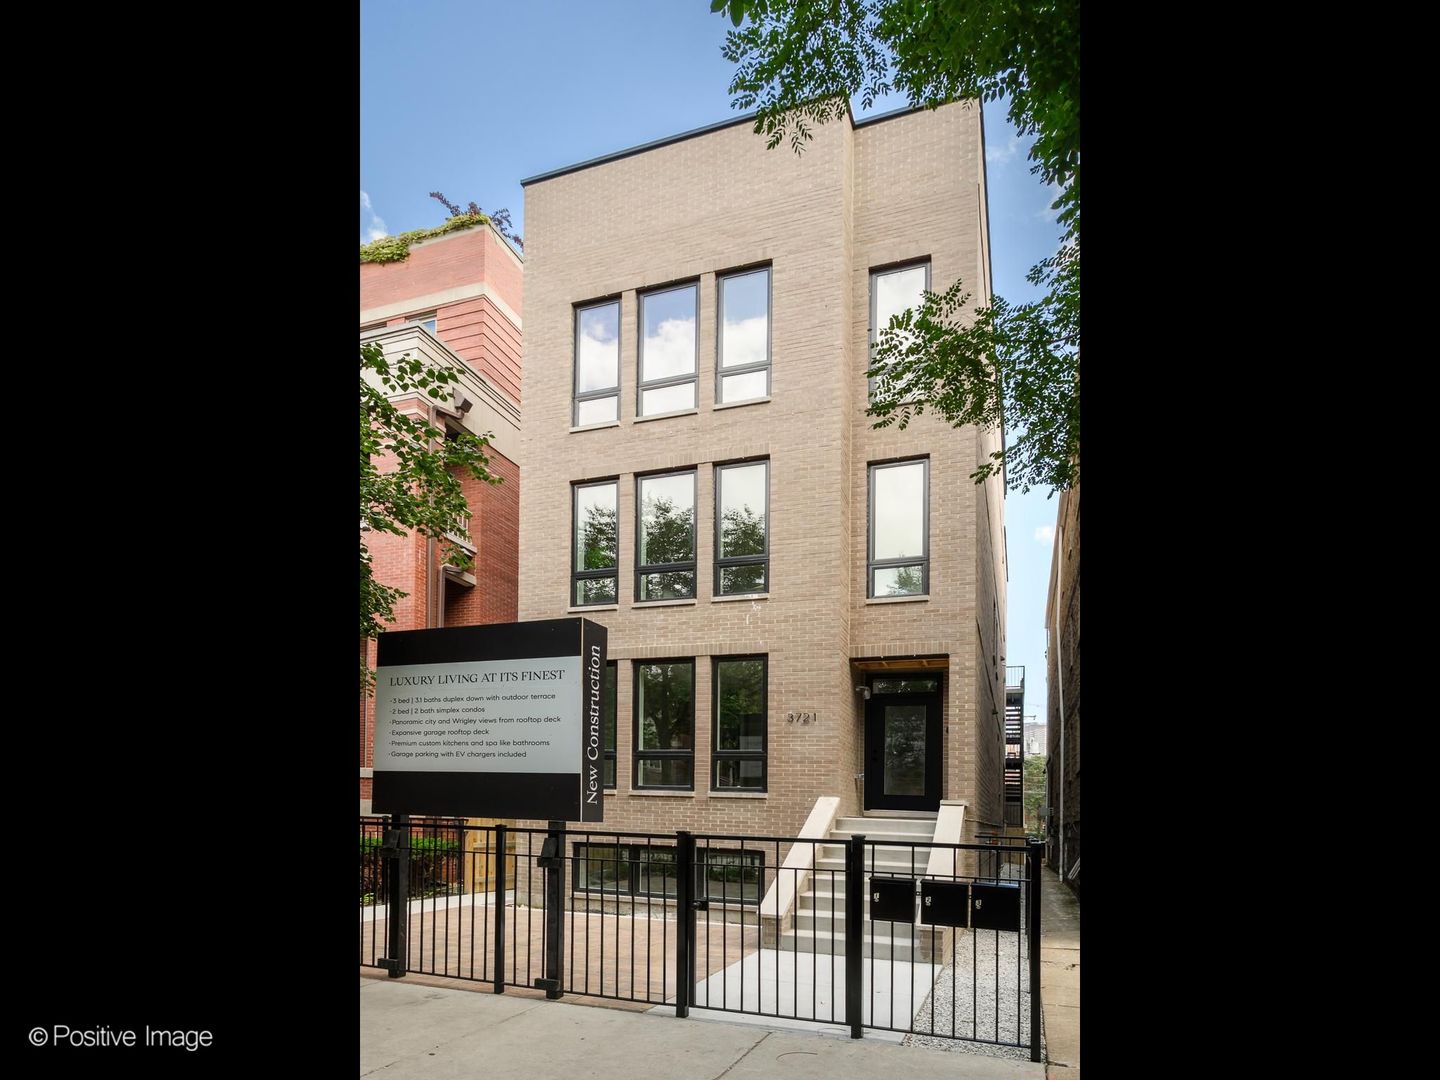
Low-rise brick buildings: vintage walk-up condos, two-flats and three-flats, a few single-family homes and newer condo buildings. Some buildings across from the ballpark have rooftop bleachers. Parking is tight, and street parking rules change on game days, so a deeded space is worth real money here.
The CTA Red Line stops at Addison, steps from the ballpark. Buses run on Clark, Addison and Halsted. Most people who live here don't drive on game days, and you'll understand why after one try.
I'm Megan Sullivan with Compass, based just west of here in Roscoe Village. I'll tell you which blocks hear the seventh-inning stretch and which ones don't, and what that difference is worth.
5,630 people live in Wrigleyville, where the median age is 33 and the average individual income is $85,899. Data provided by the U.S. Census Bureau.
Total Population
Median Age
Population Density Population Density This is the number of people per square mile in a neighborhood.
Average individual Income
There's plenty to do around Wrigleyville, including shopping, dining, nightlife, parks, and more. Data provided by Walk Score and Yelp.
Explore popular things to do in the area, including Stages Music Hall.
Wrigleyville has 2,794 households, with an average household size of 2. Data provided by the U.S. Census Bureau. Here’s what the people living in Wrigleyville do for work — and how long it takes them to get there. Data provided by the U.S. Census Bureau. 5,630 people call Wrigleyville home. The population density is 26,980 and the largest age group is Data provided by the U.S. Census Bureau.
Total Population
Population Density Population Density This is the number of people per square mile in a neighborhood.
Median Age
Men vs Women
Population by Age Group
0-9 Years
10-17 Years
18-24 Years
25-64 Years
65-74 Years
75+ Years
Education Level
Total Households
Average Household Size
Average individual Income
Households with Children
With Children:
Without Children:
Marital Status
Blue vs White Collar Workers
Blue Collar:
White Collar: